
September 2023
What was measured
We scanned the top 1000 Belgian TV, Online and Print advertisements from Sepetember 2023 ranked by media investments according to Nielsen data. From these 1000 ads, 1207 faces of talents were extracted and classified with an image analysis algorithm - and human quality control - to map the representation of age, gender and ethnicity. We use the term "talents" to refer to the actors, models and depicted persons in the ads.
| Channel | Number of assets | Number of talents |
|---|---|---|
| Television | 686 | 957 |
| Online Ads | 77 | 138 |
| 237 | 249 | |
| Total | 1000 | 1207 |
Age representation
In this chart we see the visual age distribution of talents featured in the Top 1000 ads, compared to the age of the Belgian population (green area),
The visual age distribution is centered around age group 25-34, good for 31% of all talents. The next age group is 35-44, which accounts for 23% of talents. Age groups -18 and 18-24 are 15% and 14% respectively.
Talents looking 45 and above account for only 17% of talents, while they represent 46% of the population and 53,5% of buying power.
Age distribution of casting in Top 1000 Ads compared to Belgian Population

The left-hand chart shows the age distribution of unique talents cast by various brands and agencies.
The right hand side shows the age distribution of talents based on how often the ads were broadcast. In other words, this is what the audience sees when looking at ads during the whole month. Advertisements with children and 18-24 are shown more, at the expense of ads with 25-44. There is also a slight decrease in ads featuring older talent.
Visual age distribution of casting
(unique talents)
Visual age distribution as broadcasted
(weighed by media investments)

Age by media
The way in which age is represented in different media varies. From online ads to TV ads to print advertisements, the represented age groups are getting progressively older. This indicates that marketers represent people of similar ages in theri ads as the target audience for those ads.
Online

Television


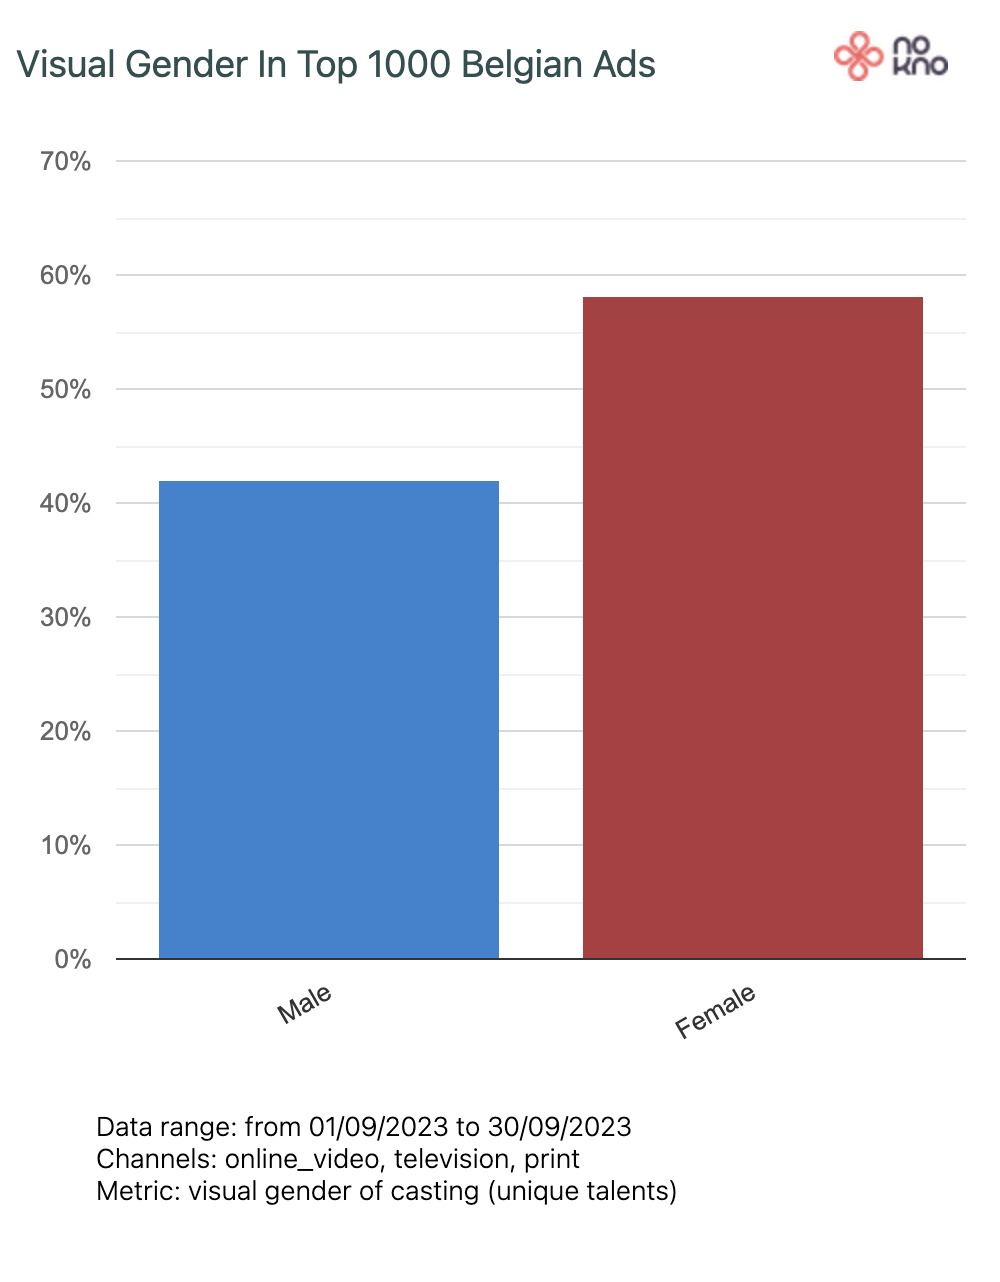
Gender representation
Gender is not a simple binary attribute that can be determined solely by visual appearance. Our model, however, categorizes people as either male or female based on their facial features.
Our analysis across different media finds 42% male talent and 58% female talent.
Visual Gender distribution of talent in Top 1000 Ads
Gender by media
In addition to a change in age, we also see a shift in gender in different media. In online ads 64% of depicted persons are women, in TV ads 57% and in print ads 54%.
Online

Television


Gender x Age
On average, female talents are younger than male talents when we cross visual age and visual gender.
We can observer that the largest male age group is 35-44, while the largest female age group is 25-34.
The 18-24 age group contains twice as many women as men (113 female versus 55 male talents), while the age groups above 45 contain almost twice as many men as women:
Age 45-54: 65 M, 43 F
Age 55-64: 56 M, 25 F
Age 65+: 12 M, 5 F
Visual Gender crossed with visual age of talent in Top 1000 Ads

Ethnic representation
In terms of ethnic diversity, the analysis shows that 81% of talents are perceived as White (White + Mediterranean/Middle Eastern) versus 19% non-White. 11% of the talents are perceived as Black, while 5% are perceived Asian.
The data model used will predict the probability of a talent belonging to an ethnic/race group based on facial features. Since the boundaries between ethnic/race groups are not hard, a talent can be perceived as having a dominant and a secondary ethnicity/race.
The model detects two kinds of White: White (lighter) and Mediterranean/Middle Eastern (darker), next to Black, Asian, South Asian (e.g. India, Pakistan) and Latine/Hispanic.
Visual Gender distribution of talent in Top 1000 Ads

Ethnicity by media
Online is the most ethnically diverse media, while print is the least ethnically diverse. In print ads, Black representation is 6% compared to 16% in online ads. In print ads, Asian representation is 0% compared to 6% in online ads.
Online

Television


Comparing sectors
Diverse representation varies by sector. As some sectors target specific age groups or genders, this is not surprising. Beauty products, for example, are typically targeted at women. However, targeting cannot explain all differences.
Seasonality is also evident in advertising. For example, summer advertising for soft drinks, in September we saw the first advertising for vitamines and cough and cold products.
Telco and Energy is one of the most diverse advertisers overall. The sector also ranks in the Top 3 when it comes to ethnic representation. Overall, gambling is the least diverse advertiser. In defense of the sector, they advertised little in August, and there are fewer than ten people depicted. This will lead to disproportionate results.
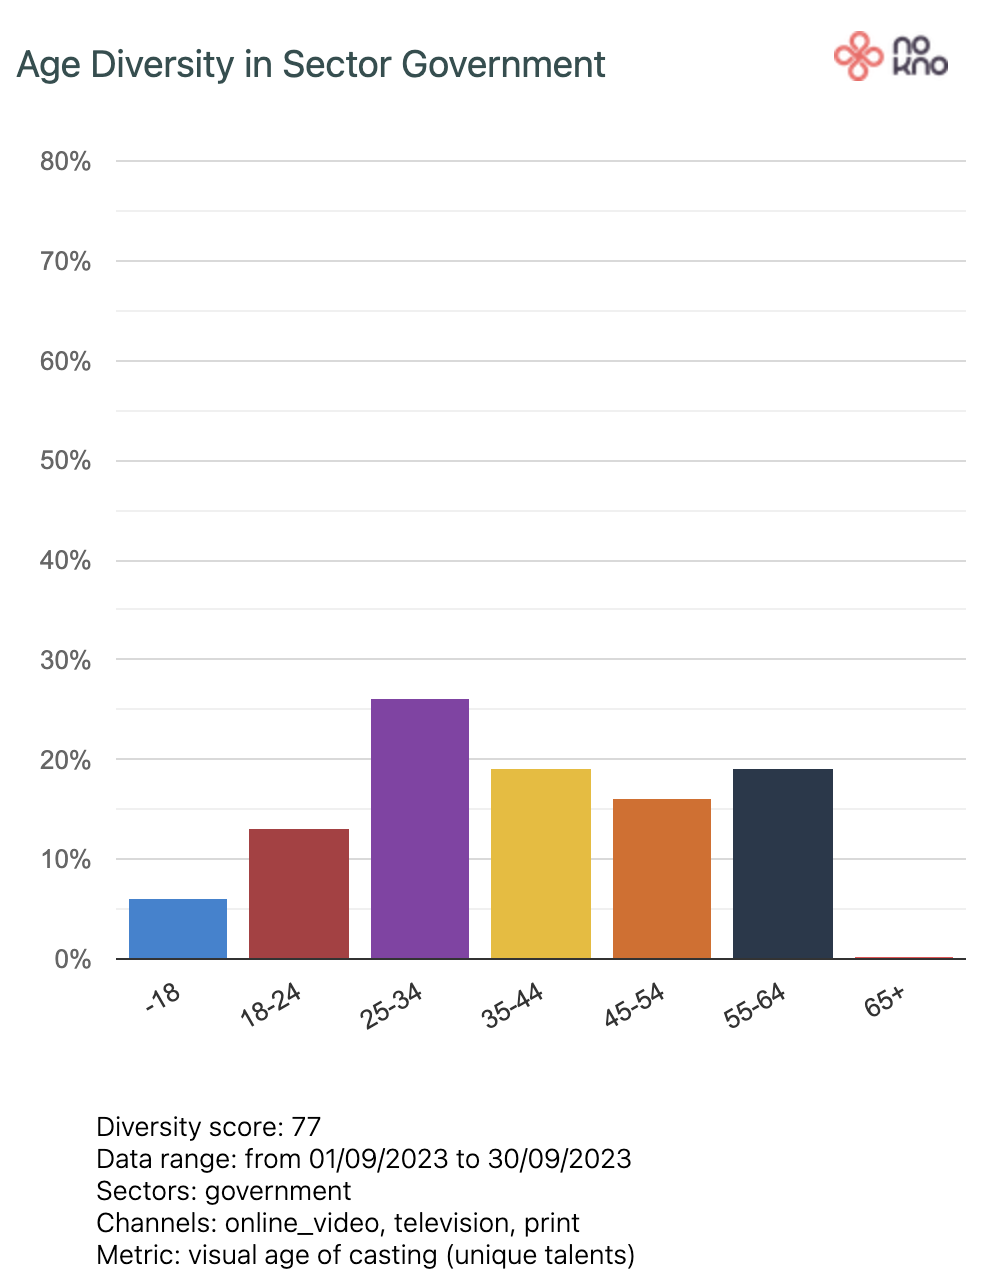
Age representation per sector
The government and public sector, with recycling campaigns, army recruitment, science and mobility projects, represent (almost) all age groups. Despite the body-positivity trend, Beauty and Hygiene advertisers are only representing by the younger generation.
| Rank | Sector | Age diversity score |
|---|---|---|
| 1. | Government and public services | 77 |
| 2. | Construction and home improvement | 77 |
| 3. | Media and publishing | 75 |
Sectors showing the most age diversity in their ads
Sectors showing the least age diversity in their ads
| Rank | Sector | Age diversity score |
|---|---|---|
| 14. | Hospitality (Horeca) | 52 |
| 15. | Beauty and hygiene | 48 |
| 16. | Gambling | 45 |
Charts comparing age diversity in the most and the second least age diverse sector

Gender representation per sector
Advertisers in the automotive industry have made huge strides from being male-dominated to being equally represented by women. The pendulum swings even further in finance and insurance ads - also a traditional male environment. In September, 70% of the talents in Finance and Insurance ads were women.
Sectors showing the most gender diversity in their ads
| Rank | Sector | Gender diversity score |
|---|---|---|
| 1. | Automotive and transportation | 50 |
| 2. | Hospitality (Horeca) | 50 |
| 3. | Appliances and electronics | 50 |
Sectors showing the least gender diversity in their ads
| Rank | Sector | Gender diversity score |
|---|---|---|
| 12. | Finance and insurance | 39 |
| 13. | Gambling | 28 |
| 14. | Beauty and hygiene | 23 |
Charts comparing gender diversity in the most and least gender diverse sector

Ethnic representation per sector
Construction and Home Improvement are the most ethnically diverse advertisers. There are very few assets in this category, and it is dominated by a diverse US-created TV spot. This explains the results. Gambling advertisers are the least diverse, but we also have a limited number of assets, which makes the results disproportionate. However, it is still possible to choose more diversity even if you have a limited number of assets.
Sectors showing the most ethnic diversity in their ads
| Rank | Sector | Ethnic diversity score |
|---|---|---|
| 1. | Construction and home improvement | 67 |
| 2. | Appliances and electronics | 57 |
| 3. | Telco and energy | 46 |
Sectors showing the least ethnic diversity in their ads
| Rank | Sector | Ethnic diversity score |
|---|---|---|
| 12. | Health and pharma | 34 |
| 13. | Cleaning products | 32 |
| 14. | Gambling | 28 |

Charts comparing ethnic diversity in the most and least ethnic diverse sector

Methodology
If you have questions about the methodology or the technology used to creat the Belgian Ad Diversity Barometer, check our methodology page.