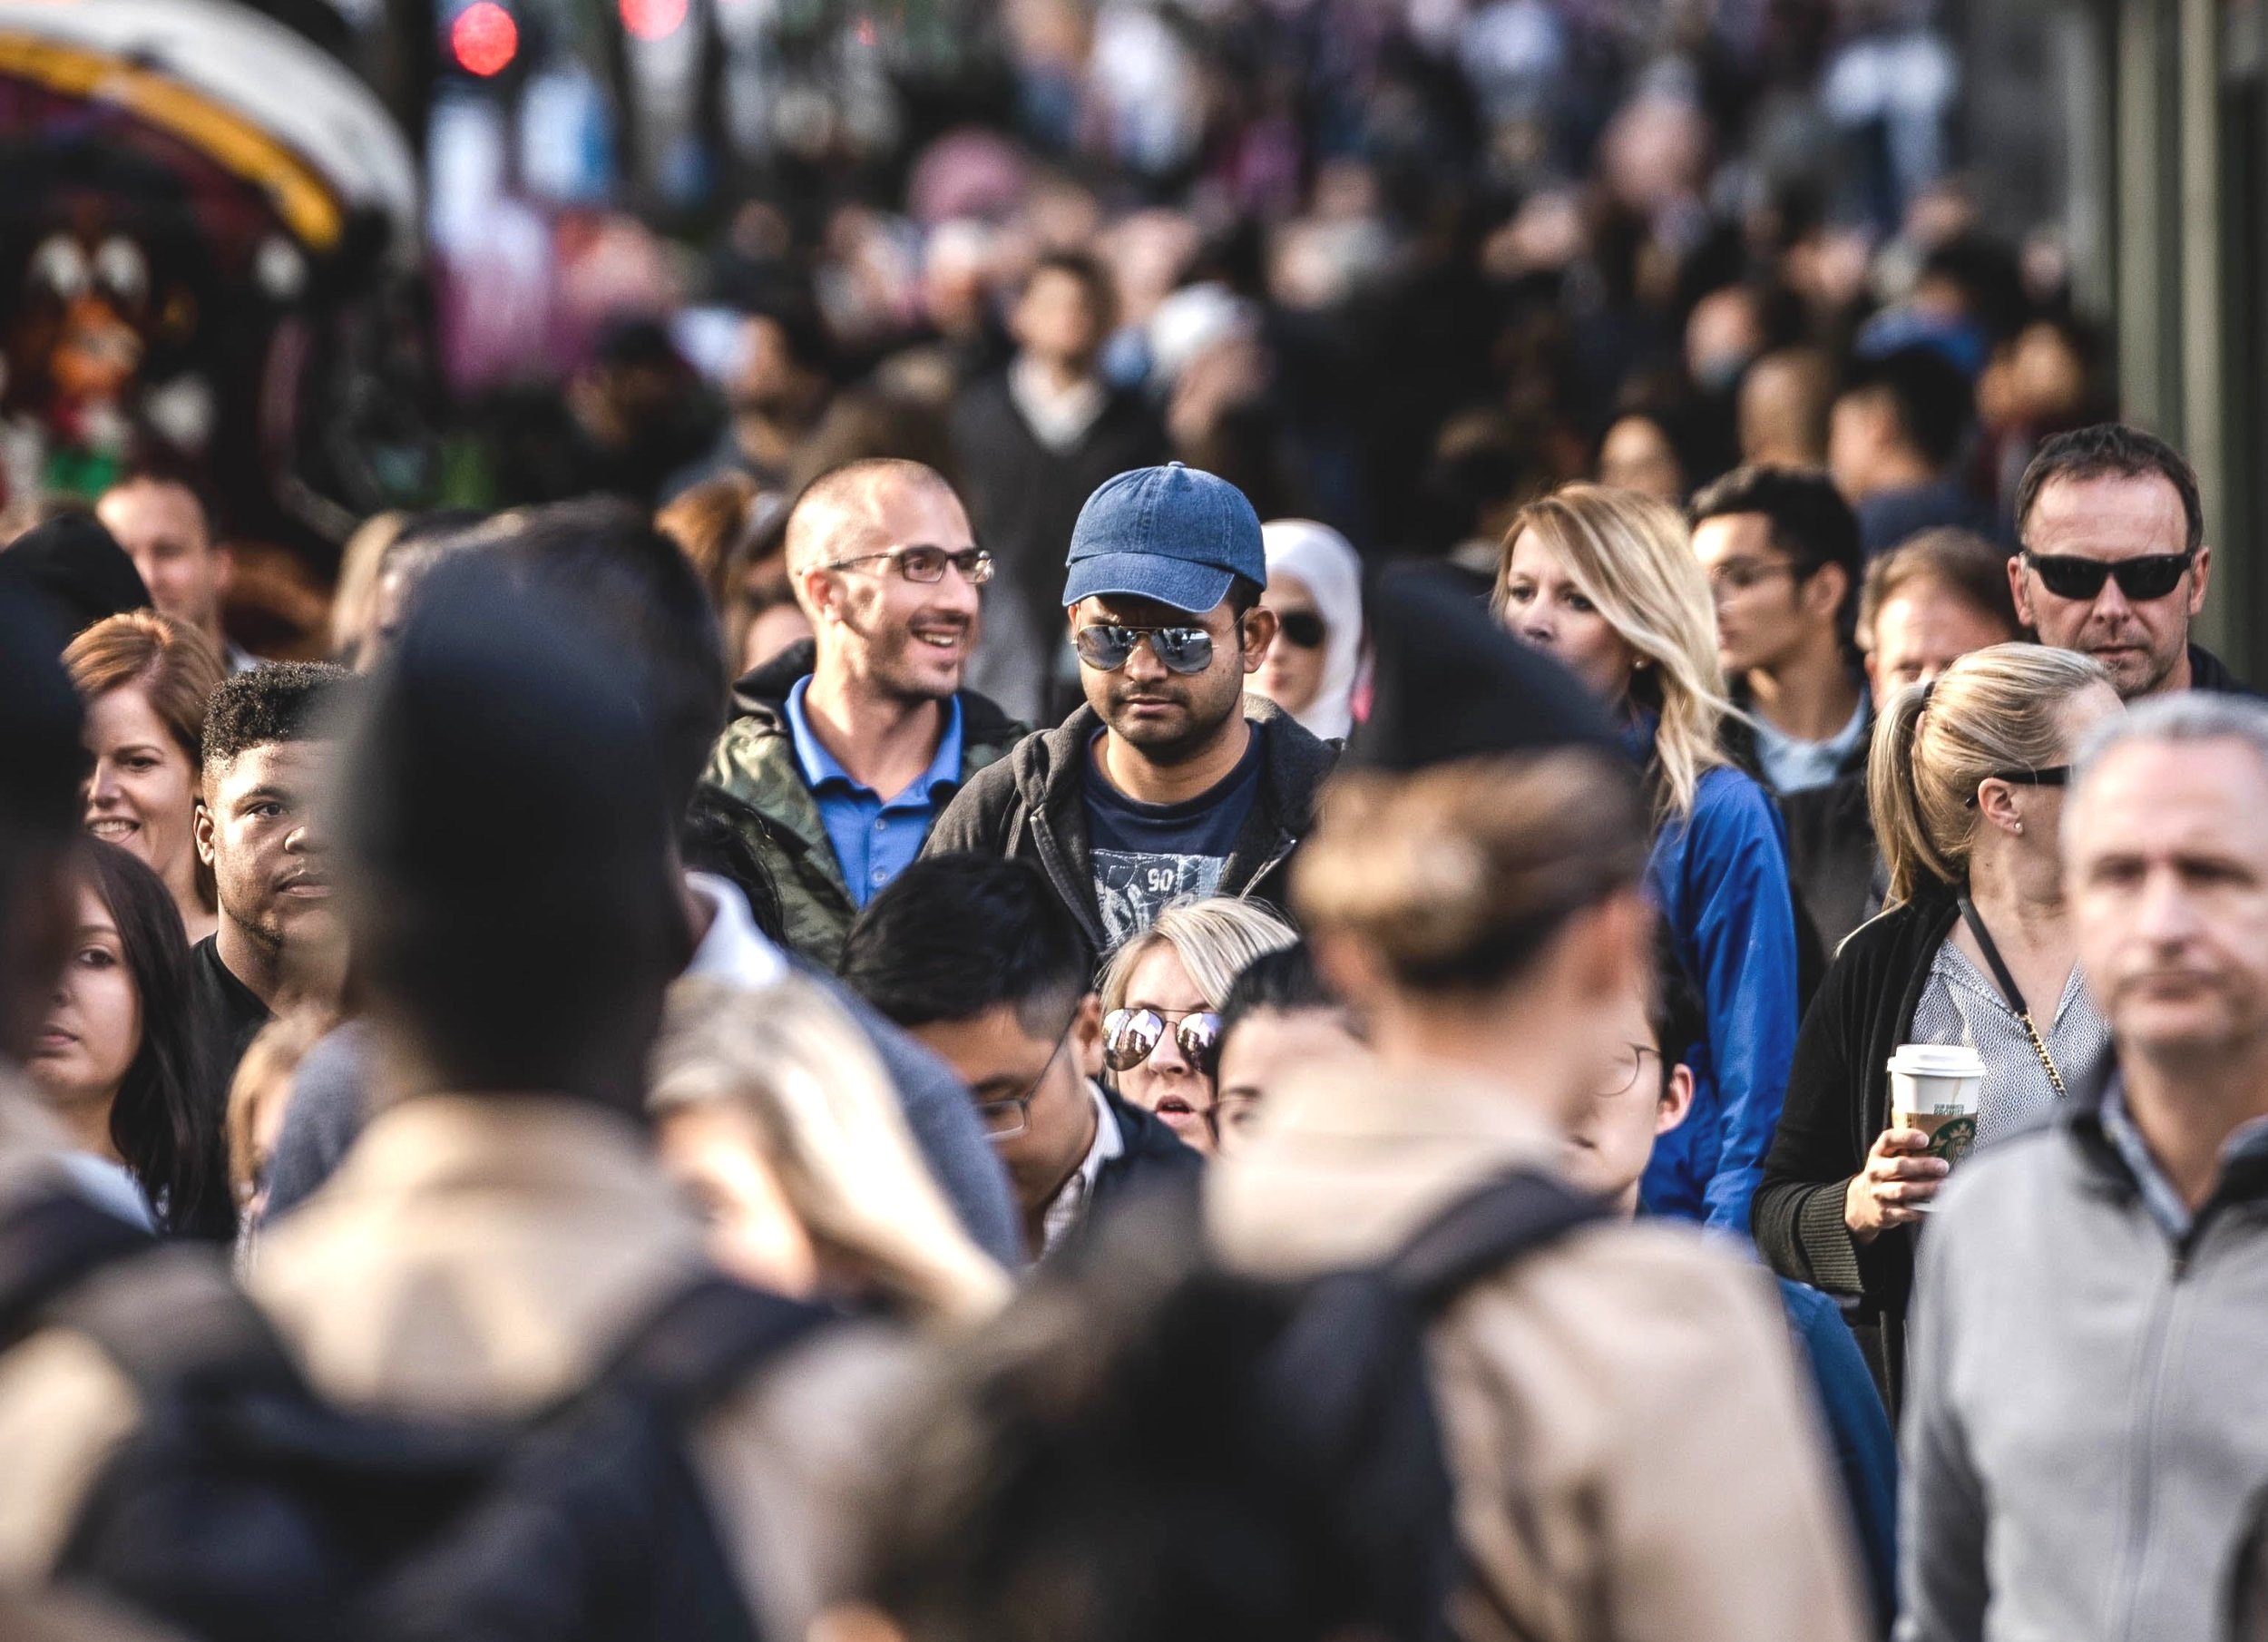
How diverse is Belgian advertising?
Are we making progress in representing society’s diversity and making it more inclusive? The Belgian Ad Diversity wants to help by measuring the diversity and representation of age, gender and ethnicity in Belgian advertisements.
Each month we scan the top 1000 Ads of the top 100 Belgian Advertisers, measured by media spend. This page gives the highlights of the past 12 months.
Overall, we can state that Belgian advertising makes efforts, but they are fragmented across media channels and sectors.
Check the detailed analysis per month
Marketers suffer from gerontophobia
It is no surprise that the age representation in advertising is significantly younger than the actual age of the Belgian population (green area).
The visual age distribution is centered around age groups 25-34 and 35-44 , good for 31% and 21% of all talent respectively. The next age group is -18, which accounts for 16% of talent. Age groups 18-24 and 45-54 are 15% and 10% respectively.
Obviously advertising is always aspirational and a 50-year old may feel represented by a 40-year old, but there's a limit to this flexibility.
People looking 45 and above account for only 17% of talents, while they represent 46% of the population and 53,5% of buying power.

Age representation across different channels
Representation of age varies depending on the medium. The age groups represented in advertisements are getting progressively older from online and TV ads to print advertisements. This indicates that advertisers represent similar-aged people as the target audiences that those specific media channels reach.
Online

Television


Evolution of age representation
Looking at the data month by month, age groups tend to fluctuate by no more than ±10%.
In October and November, the under-18 age group rises to 20%, compared to just 9% during the summer months. Conversely, the 25-34 age group is the largest during the summer, making up 37% of all talent, but hits its lowest point in October and November.
The age groups over 45, as well as the 18-24 group, remain fairly stable, with only minor variations of a few percentage points.
These trends are likely seasonal; for instance, ads for Toys and children's Food and Drinks feature children more during the winter months, while ads for Events and adult Food and Drinks (e.g Alcohol) are more common in the summer.

Ladies first, but fading
We acknowledge that gender is not simply a binary attribute determined by appearance. However, our computer vision algorithm used to analyse the Top 1000 ads categorises people based on their facial features as either male or female.
According to our analysis 47% of the talent looks male and 53% looks female.

Gender representation across different channels
Over the whole year, 55% of depicted persons are women in online ads, in TV ads 54% and in print ads 49%.
Online and TV ads show slightly younger and more female talent, while print ads show older and more gender-balanced talent.

Evolution of gender representation
When we look month per month, female representation in the Top 1000 Ads has declined. Across all channels, the highest percentage of women was observed in September 2023 and February 2024 at 58%, while the lowest occurred in June 2024 at 48%.
The most significant drop was in online video ads, where female representation fell from 64% in September 2023 to just 39% in June 2024. It's unclear whether this decline is a seasonal trend or indicates a more permanent shift.

Old cattle and young grass
On average, female talents are younger than male talents when we cross visual age and visual gender.
We can observer that the largest male age group is 35-44, while the largest female age group is 25-34.
| Age | Male | Female | Difference F-M/F+M |
|---|---|---|---|
| 65+ | 1% | 1% | 0% |
| 55-64 | 5% | 2% | -43% |
| 45-54 | 7% | 4% | -27% |
| 35-44 | 12% | 10% | -9% |
| 25-34 | 13% | 18% | 16% |
| 18-24 | 5% | 10% | 33% |
| -18 | 5% | 9% | 29% |
As depicted talent gets older, we see ±43% less female talent, as they get younger we see ±33% more female talent.
This trend was consistent over the last 12 months. And it is consistent with reports from the media and film industry.
Age x Gender of casting in Top 1000 Ads

But young and beautiful is what audiences want
— ill-informed old school marketeer
Some marketeers may argue that audiences want to see a young and beautiful version of themselves, rather than reality. This is an outdated notion. We see in trend reports that authenticity and vulnerability have gained much more importance than unattainable aspirations since COVID.
Research shows that age and gender representation are critical for ad effectiveness. An Ulster University study exposed 659,522 Facebook users to ads for a beauty product featuring models of different genders and ages and recorded 1,733 unique clicks. According to the results, older women, older men, younger women and younger men all clicked more on ads with models of a similar age and gender than on ads where the gender and/or age was be different. The CTR for older women increased by 125%, for older men by 190%, for younger women by 227%, and for younger men by 323% when seeing someone that looks like them.
Ads featuring models of the same age and gender as the audience have a 216% higher click-through rate
than ads featuring models of the opposite age group and/or gender.
Ethnic diversity
Diversity in advertising has received a lot of attention since the Black Lives Matter Movement. The Belgian advertising industry has made great strides in the past decade, although not all sectors are at the same level. A lot of the diversity in locally aired advertisements comes from internationally produced TV ads.
Our analysis shows that 83% of talents are perceived as White (60% Northern/Western/Eastern European White + 23% Mediterranean/Middle Eastern) versus 17% non-White. 9% of the talents are perceived as Black, while 4% are perceived Asian.
The data model used will predict the probability of a talent belonging to an ethnic/race group based on facial features. Since the boundaries between ethnic/race groups are not hard, a talent can be perceived as having a dominant and a secondary ethnicity/race.
The model detects two kinds of White: White (lighter) and Mediterranean/Middle Eastern (darker), next to Black, Asian, South Asian (e.g. India, Pakistan) and Latine/Hispanic.

Belgium is a very ethnically diverse country: 33% of the population comes from migration backgrounds (first or second generation). 16,1% have an EU migration background, while 17,3% have a non-EU migration background. As Belgium does not report detailed ethnic data, it is difficult to determine if the ethnic representation in the barometer is representative of the population. In general, we can say that diversity in ads and diversity in society are of the same magnitude, but ethnic diversity varies widely between urban and rural areas.

Ethnic diversity across channels
Furthermore, ethnic diversity varies across generations in addition to the uneven geographical spread. The percentage of people with migration backgrounds may be less than 10% in older generations, while it may reach more than 50% in younger generations in inner cities. Different advertising channels reflect this trend. Online ads, which frequently target younger generations, show more ethnic diversity than print ads, which typically target older people.
Online

Television


We also eat chocolate


FutureKind and No-Kno conducted focus groups with Muslim consumers for their trend report "De Nieuwe Moslimconsument". According to the focus group, Muslims do not want to be represented only in Ramadan campaigns or in campaigns for culturally-relevant products. Other international studies have also found a similar wish for normalization.
One of the respondents remarked, "We also eat chocolate. Why don't we ever see a Maroccan-Belgian family eating together in a commercial?"
As if Colruyt had listened in, they did exactly that. For the Boni brand, Colruyt created a number of product advertisement for daily products, featuring a traditional Belgian family, and another featuring a Belgian Muslim family.
As far as we are aware, this is the first time this is done in Belgian TV advertising.
Evolution of ethnic representation
When we look at the ethnic/racial representation month per month, we see a slight trend towards more ethnic representation.
Asian representation ranges between 3% and 6%, while Black representation ranges between 8% and 12%.
Northern / Western / Eastern European White looking talent seems to have dropped from over 69% in October 2023 to 55% in April 2024, while Mediterranean White / Middle Eastern looking talent has increased.
The chart shows the evolution of the Ethnicity Diversity Score, a statistical measure of how equally different groups are represented. A score of 100 indicates perfectly equal representation of all groups, while a score of 0 means only one group is represented.
It's important to note that the score doesn't imply that 100 is better than 0. It's simply a tool for comparing diversity levels, indicating whether ethnic representation is more or less present.
As we can see from the chart, the trendline for ethnic diversity is slightly rising, meaning there has been greater ethnic diversity in recent months compared to earlier ones.


Comparing sectors
Diverse representation varies by sector. As some sectors target specific age groups or genders, this is not surprising. Beauty products, for example, are typically targeted at women. However, targeting cannot explain all differences.
Age representation

Sectors portraying the most age diversity
Media and publishing
Health and pharma
Food and drinks
Distribution and retail
Advertisers who reach the whole population and are not overly obsessed with youth are the most age-diverse.
That the Toys sector is not age-diverse is normal. The Beauty sector on the other hand, seems to stick to the notion that audiences want to see young people. Age-diversity is very limited in Beauty ads.
79% of talent in the Beauty sector is under 35, despite the body-positive trend, which suggests inclusivity.
Gender representation

Sectors with an equal gender balance
Cleaning products
Food and drinks
Appliances and electronics
Media and publishing
Automotive and transportation
Women will be happy to learn that there are as many men as women shown in Cleaning Product and Kitchen Appliances ads. Whether this translates into men doing more household cleaning remains to be seen. Women still handle most domestic chores, according to the Gezinsenquête.
Traditionally, the automotive industry is seen as a male-dominated field. However, things seem to be changing. For example, Audi and Porsche show more women driving their cars than men.
Ethnic representation

The most ethnically diverse advertising sectors
Automotive and transportation
Beauty and hygiene
Hospitality
Telco and energy
Internationally produced TV ads dominate the Automotive, Hospitality (Fast food and Food delivery) and Beauty categories. These tend to be more ethnically diverse than locally produced ads. However, there is clearly a trend toward more ethnic representation in sectors where local brands are strong, such as Telco and Energy, and Finance and Insurance.
Advertising in the Media sector is consistently among the least diverse. They typically feature a lot of "Bekende Vlamingen" and "Wallons célèbres" from not very diverse backgrounds.
Portraying people with disabilities
As of January, our image analysis algorithm detects visually detectable disabilities, including wheelchairs, mobility aids, canes, and prosthetic limbs. There are of course many more disabilities, but not all can be detected visually.
Since January, we've identified 12 out of 630 brands featuring people with disabilities in their ads. Each month, between 2 and 6 out of 1000 spots have included visible disability representation. The highest level of disability representation occurred in July 2024, due to the upcoming Paralympics.
Of the twelve brands featuring people with disabilities, five focused on (Paralympic) athletes, while the other five depicted individuals with disabilities without making their disability central to the storyline. This approach contributes to the normalisation of people with disabilities in advertising.


In-depth analysis
Check out the monthly in-depth analysis, for more details and more info on sectors.
Check detailed analysis per month
Methodology
If you have questions about the methodology or the technology used to create the Belgian Ad Diversity Barometer, check our methodology page.