
February 2024
What was measured
We analysed the top 1000 Belgian TV, Online, and Print advertisements from February 2024 ranked by media investment. We extracted 1082 faces of talent from these ads and mapped the representation of age, gender, and ethnicity using an image analysis algorithm and human quality control. "Talents" refer to actors, models, and depicted persons in advertisements.
| Channel | Number of assets | Number of talents |
|---|---|---|
| Television | 649 | 819 |
| Online Ads | 90 | 157 |
| 261 | 183 | |
| Total | 1000 | 1082 |
Remark: Some talents will appear in ads on multiple channels, therefore the total of all channels is not the sum. The total of all channels is the number unique talents across all channels.
Age representation
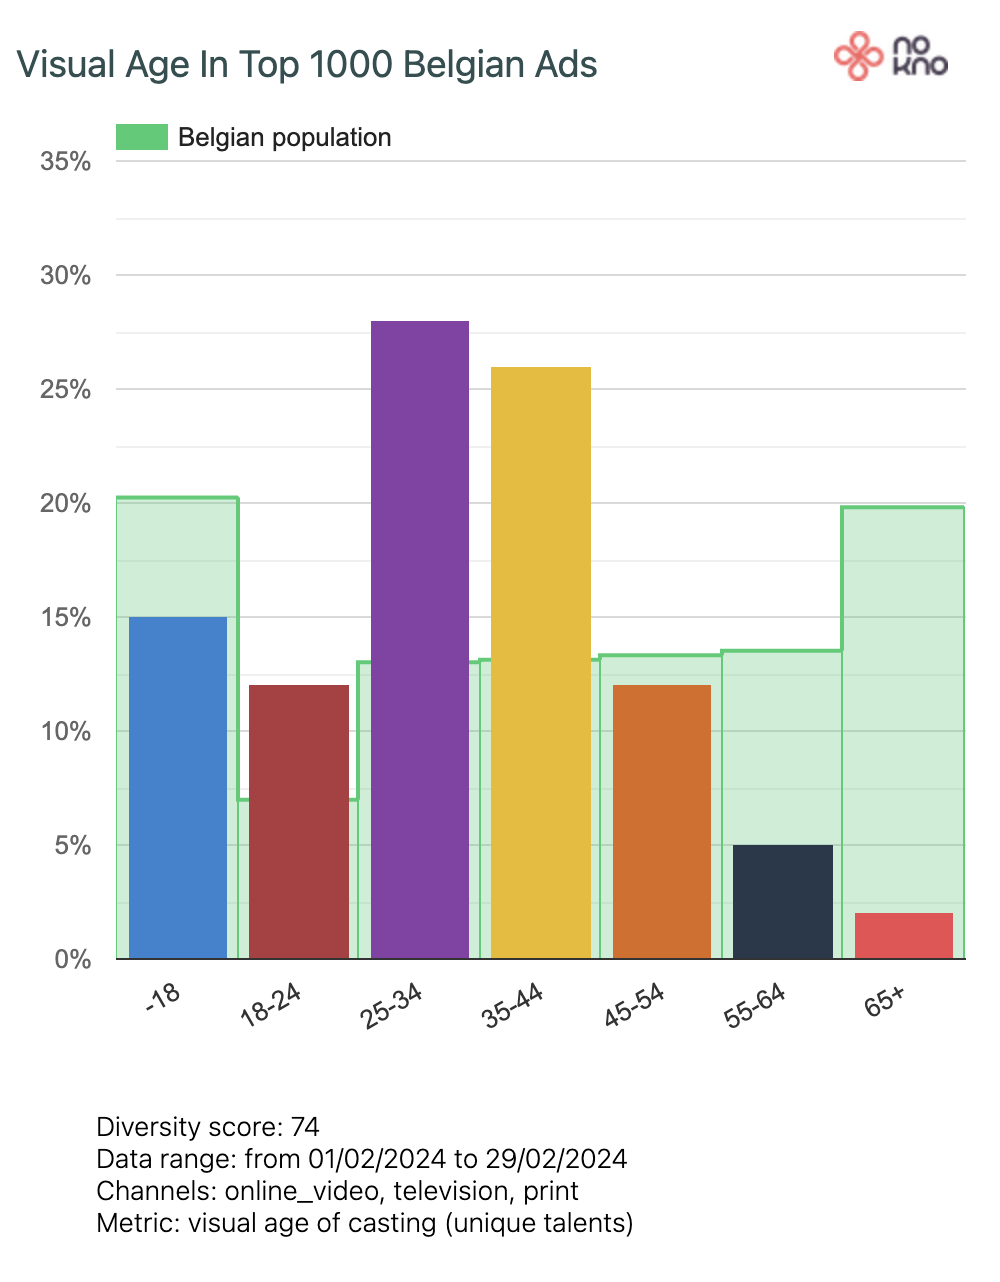
In this chart we see the visual age distribution of talents featured in the Top 1000 ads, compared to the age of the Belgian population (green area),
The visual age distribution is centered around age groups 25-34 and 35-44 , good for 28% and 26% of all talent respectively. The next age group is -18, which accounts for 15% of talent. Age groups 18-24 and 45-54 are both 12%.
Talents looking 45 and above account for only 19% of talents, while they represent 46% of the population and 53,5% of buying power.
Age distribution of casting in Top 1000 Ads compared to Belgian Population
Age by media
Online Ads feature the youngest talent, closely followed by TV ads. As in previous months, Print Ads shift significantly towards older talent. Talent looking older than 45 accounts for 31% in Print Ads vs 13% in Online Ads. Talent looking younger than 25 accounts for 15% in Print Ads vs 37% in Online Ads.
Online

Television


Gender representation
Gender isn't simply a binary attribute determined by visual appearance. Our model, however, uses facial features to determine whether a person looks male or female.
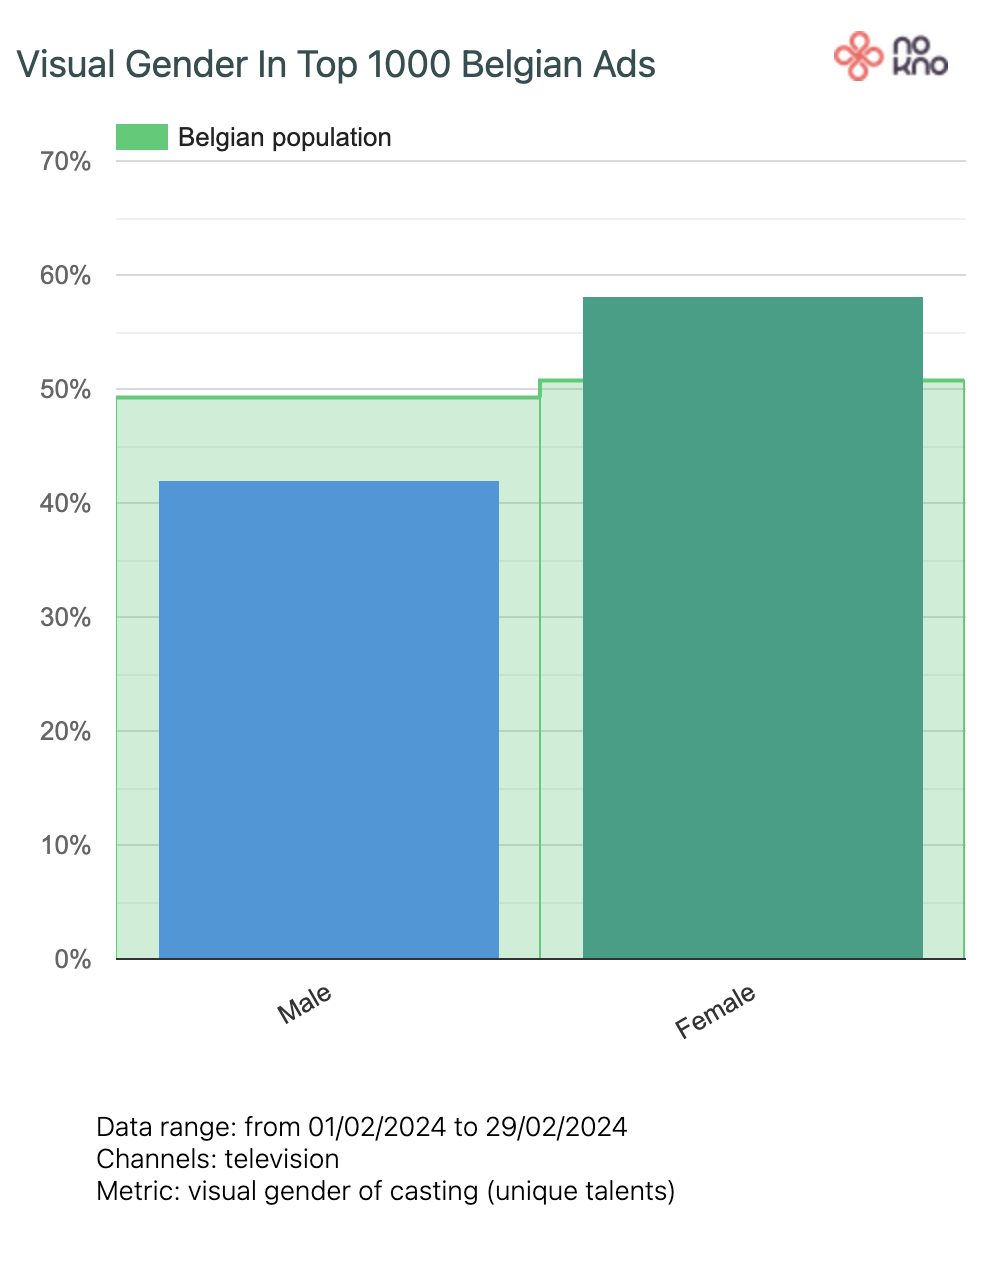
Across the Top 1000 ads, we find 42% male talents and 58% female talents. This is shift towards female compared to previous months where the ratio male / female was closer to 55 / 45.
Visual Gender distribution of talent in Top 1000 Ads

Gender by media
In addition to a change in age, we also see a shift in gender in different media. In online ads 61% of depicted persons are women, in TV ads 58% and in print ads 54%. Online Ads featuring more female talent than TV and TV more than Print is consistent with previous months. However in previous months Print Ads would typically show more male than female talent. This is not the case in February.
Online

Television

Gender x Age
Female talents are younger than male talents when we cross visual age and visual gender. Under the age of 35 we see more female talent, over the age of 35 we see less female talent in the Ads. We observe this trend month after month, but in other months the age group 35-44 tended to be more balanced.
| Age | Male | Female | Difference F-M/F+M |
|---|---|---|---|
| 65+ | 1% | 1% | 0% |
| 55-64 | 4% | 2% | -33% |
| 45-54 | 6% | 5% | -9% |
| 35-44 | 14% | 11% | -12% |
| 25-34 | 12% | 15% | 11% |
| 18-24 | 4% | 9% | 38% |
| -18 | 7% | 10% | 18% |
Visual Gender crossed with visual age of talent in Top 1000 Ads

Ethnic representation
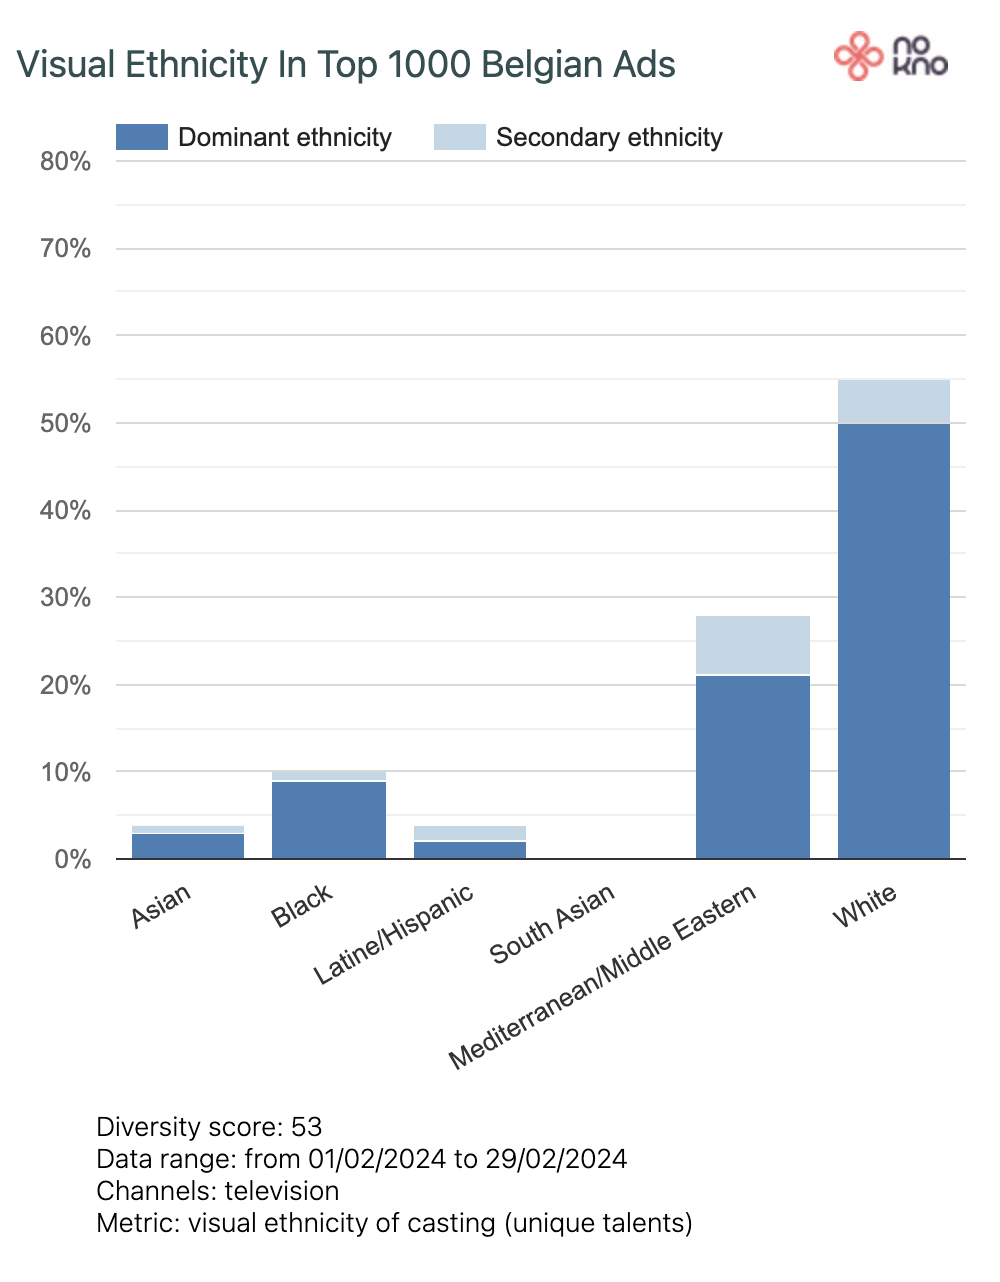
According to the analysis, 84% of talents are perceived as White (57% White + 27% Mediterranean White/Middle Eastern) compared to 16% non-White. Black talent makes up 9% of depicted persons, while Asian talent makes up 4%. This is in line with previous months.
Based on facial features, the data model predicts the likelihood that a talent belongs to one of the ethnic/race groups. Due to the fact that there are no hard boundaries between ethnic/race groups, a talent can be perceived as having a dominant and a secondary ethnicity/race.
In addition to White (lighter) and Mediterranean White/Middle Eastern (darker), the model detects Black, Asian, South Asian (e.g. India, Pakistan) and Latine/Hispanic looking people.
Visual Ethnicity distribution of talent in Top 1000 Ads

Ethnicity by media
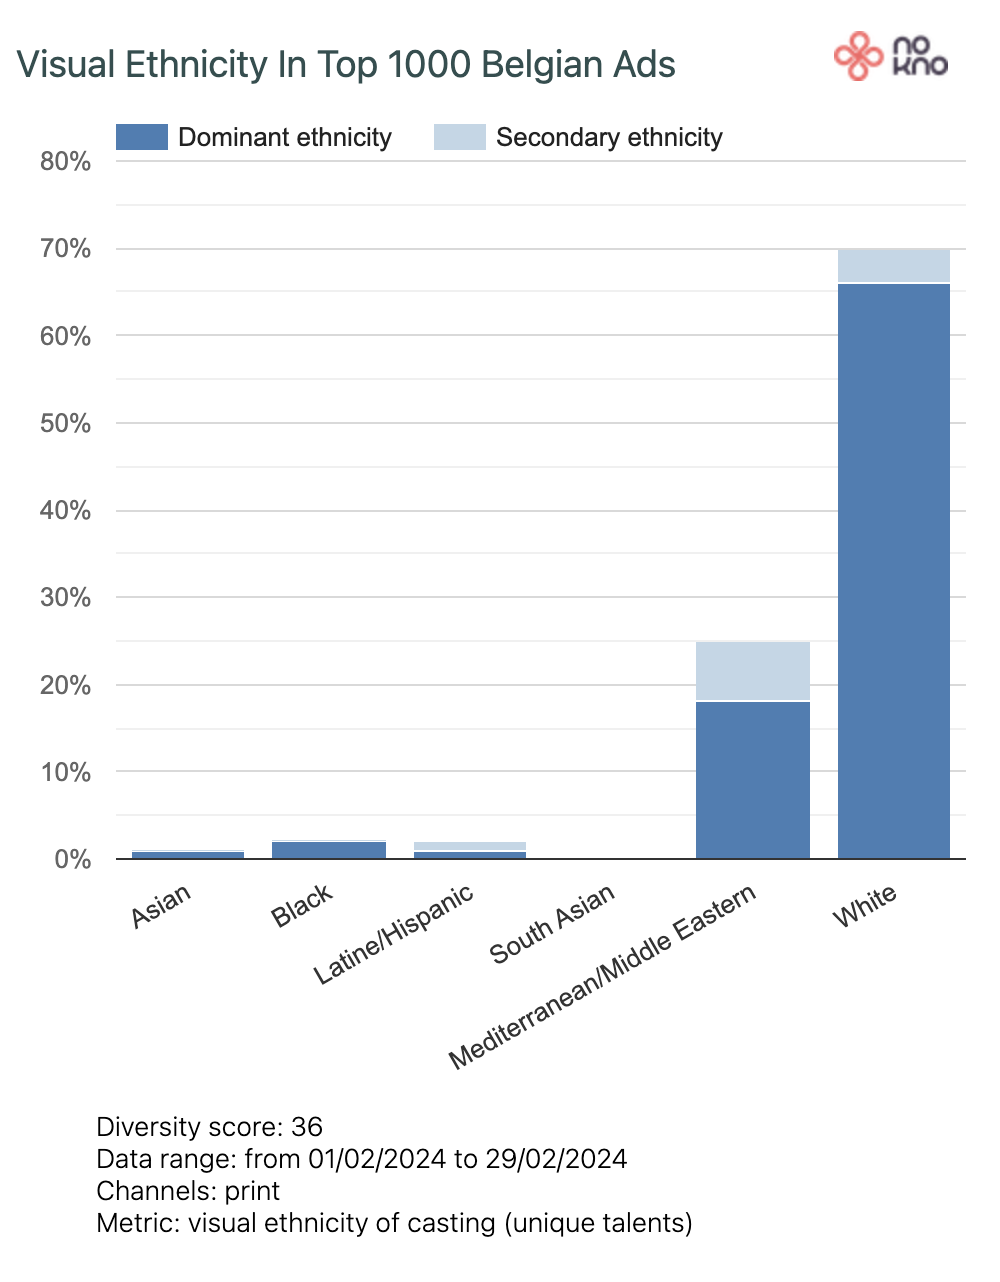
We see the most ethnic diversity in Online Ads, followed by TV Ads. Print Ads show the least - almost no - ethnic diversity. Print Ads portraying hardly any ethnic diversity can be observed in previous months too.
Online

Television
Representation of Disability
Along with demographic representation, our image analysis algorithm detects visually detectable disabilities, including wheelchairs, mobility aids, canes, and prosthetic limbs.
There were four brands that portrayed people with disabilities. Jez, Colruyt, Base and Vlaamse Gemeenschap. Jez shows a number of video and image ads featuring a wheelchair athlete. Base and Colruyt feature people with disabilities without making disability the central focus. This approach helps normalise disabilities and promoting inclusivity. Vlaamse Gemeenschap shows prosthetic legs as an innovation.


Comparing sectors
In January the top advertisers were Automotive brands (with the traditional auto deals in January because of the Brussels Motor Show), followed by Media and Publishing and Distribution and Retail. In February the biggest advertisers come from the Media and Publishing (mainly TV, Radio and Magazine brands) sector, followed by Distribution and Retail (mainly Supermarkets and Online retailers) and Food and Drinks
The representation of diversity also varies across sectors. In some sectors, specific age groups or genders are targeted. Beauty products, for example, are typically marketed to women. Targeting cannot explain all differences, however.
Age representation per sector
Food and Drinks, Media and Publishing (media brands, TV stations, magazines, …) and Events show the most age diversity, this means representing a wide range of ages.
As in previous months, the Beauty and Hygiene sector seems to stick to the notion that young is beautiful and aspirational for older audiences. As in January Cleaning Product Ads show the least age diversity.
Sectors showing the most age diversity in their ads
| Rank | Sector | Diversity score | % 45+ |
|---|---|---|---|
| 1. | food and drinks | 76 | 19% |
| 2. | media and publishing | 73 | 33% |
| 3. | toys and events | 73 | 18% |
Sectors showing the least age diversity in their ads
| Rank | Sector | Diversity score | % 45+ |
|---|---|---|---|
| 9. 10. |
beauty and hygiene automotive and transportation |
62 | 6% |
| 12. | cleaning products | 61 | 13% |
Charts comparing age diversity in the most and least age diverse sector


Gender representation per sector
Events Ads, followed by Telecom and Energy, Automotive, Cleaning Products and Media and Publishing are the most female - male balanced. Beauty and Hygiene show mostly women, this is not surprising.
Just as in January, Finance and Insurance Ads skew female. This may surprise considering Finance and Insurance were traditionally male-dominated industries. Nevertheless, if we look beyond stereotypes and consider who is actually involved in family administration, we find a balanced picture. In the Gezinsenquête, 40.2% of parents (with one or more children under 25 years old) indicated that the father always or usually handles the bills in the family, while in 36.7% of cases, the mother always or usually pays bills. 22,9% of parents state they both pay bills equally often.
Sectors showing the most gender diversity in their ads
| Rank | Sector | Diversity score | % Female |
|---|---|---|---|
| 1. | toys and events | 50 | 50% |
| 2. | telco and energy | 50 | 49% |
| 3. | automotive and transportation cleaning products |
50 | 47% |
| media and publishing | 50 | 53% |
Sectors showing the least gender diversity in their ads
| Rank | Sector | Diversity score | % Female |
|---|---|---|---|
| 10. | tourism and culture | 46 | 62% |
| 11. | finance and insurance | 44 | 64% |
| 12. | beauty and hygiene | 15 | 90% |
Charts comparing gender diversity in the most and least gender diverse sector


Ethnic representation per sector
Like in January, most ethnic diversity is shown in automotive and transportation ads (only car brands in February). Car brands usually produce international campaigns, and we know that international campaigns are often more diverse than local campaigns. While reviewing the chart, however, we must keep in mind that the number of talents in automotive ads in February is limited (36 persons were detected), which may skew the results.
Similar to previous months, Media and Publishing Ads are among the least ethnically diverse. Typically, they feature many "Bekende Vlamingen" and "Wallons célèbres“, which tend to be ethnically homogenous. Due to the fact that Event ads feature the same Media brands, ethnic diversity is limited.
Sectors showing the most ethnic diversity in their ads
| Rank | Sector | Diversity score |
|---|---|---|
| 1. | automotive and transportation | 69 |
| 2. | appliances and electronics distribution and retail |
59 |
Sectors showing the least ethnic diversity in their ads
| Rank | Sector | Diversity score |
|---|---|---|
| 10. | health and pharma | 48 |
| 11. | media and publishing | 41 |
| 12. | toys and events | 39 |
Charts comparing ethnic diversity in the most and least ethnic diverse sector

Methodology
If you have questions about the methodology or the technology used to creat the Belgian Ad Diversity Barometer, check our methodology page.