
August 2023
What was measured
We scanned the top 1000 Belgian TV, Online and Print advertisements from August 2023 ranked by media investments according to Nielsen data. From these 1000 ads, 1259 faces of talents were extracted and classified with an image analysis algorithm - and human quality control - to map the representation of age, gender and ethnicity. We use the term "talents" to refer to the actors, models and depicted persons in the ads.
| Channel | Number of assets | Number of talents |
|---|---|---|
| Television | 562 | 993 |
| Online Ads | 108 | 135 |
| 328 | 189 | |
| Total | 998 | 1259 |
Age representation
In this chart we see the visual age distribution of talents featured in the Top 1000 ads, compared to the age of the Belgian population (green area),
The visual age distribution is centered around age group 25-34, good for 32% of all talents. The next age group is 35-44, which accounts for 24% of talents. Age groups -18 and 18-24 are 13% and 12% respectively.
Talents looking 45 and above account for only 17% of talents, while they represent 46% of the population and 53,5% of buying power.
Age distribution of casting in Top 1000 Ads compared to Belgian Population

Age by media
Age representation differs per media. Online Ads and Television Ads feature more children and 18-24, while Print ads feature significantly more people older than 45. This suggests that marketers feature people of similar ages as their target audience. In other words, marketers believe in age representation.
Online

Television


Gender representation
We realise that gender is not a simple binary attribute that can be determined by visual appearance alone. However, our model looks at facial features to classify a person binary, as male or female.
Across different media, we find 46% male talents and 56% female talents.
Visual Gender distribution of talent in Top 1000 Ads

Gender x Age
On average, female talents are younger than male talents when we cross visual age and visual gender.
The 18-24 age group contains almost twice as many women as men (103 female versus 53 male talents), while the age groups above 45 contain almost twice as many men as women:
Age 45-54: 85 M, 41 F
Age 55-64: 45 M, 24 F
Age 65+: 20 M, 8 F
Visual Gender crossed with visual age of talent in Top 1000 Ads

Ethnic representation
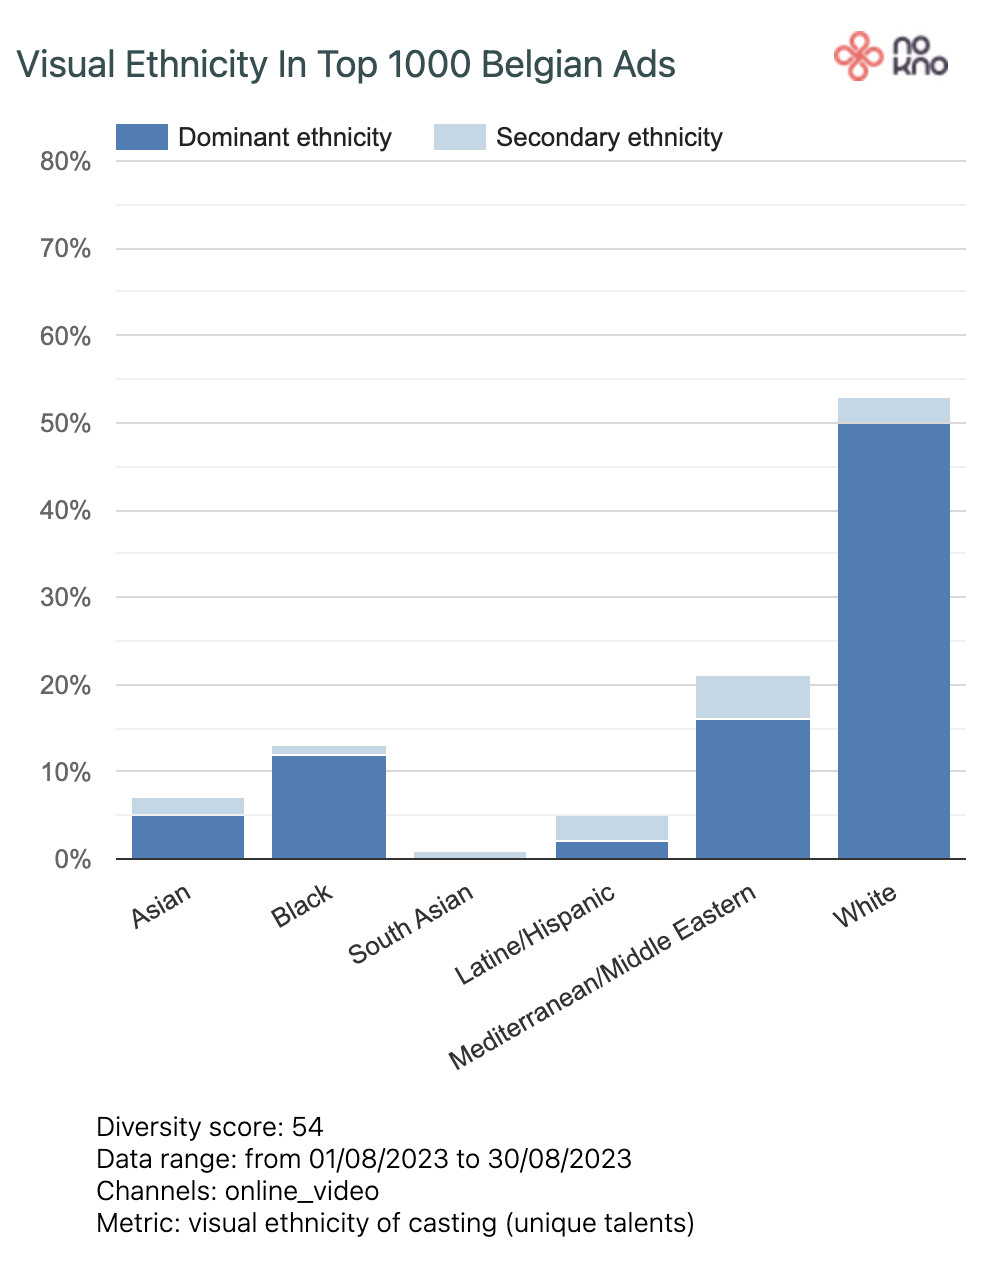
In terms of ethnic diversity, the analysis shows that 81% of talents are perceived as White (White + Mediterranean/Middle Eastern) versus 19% non-White. 10% of the talents are black, while 5% are Asian.
The data model used will predict the probability of a talent belonging to an ethnic/race group based on facial features. Since the boundaries between ethnic/race groups are not hard, a talent can be perceived as having a dominant and a secondary ethnicity/race.
The model detects two kinds of White: White (lighter) and Mediterranean/Middle Eastern (darker), next to Black, Asian, South Asian (e.g. India, Pakistan) and Latine/Hispanic.
Visual Gender distribution of talent in Top 1000 Ads

Ethnicity by media
Online is the most ethnically diverse media, while print is the least ethnically diverse. In print ads, black representation is 4% compared to 13% in online ads. In print ads, asian representation is 1% compared to 7% in online ads.
Online
Television


Comparing sectors
Sectors vary in their representation of diversity. This is not surprising, since some sectors target specific age groups or genders. It is typical for beauty products to target women, for example. But not all differences can be explained by targeting.
Advertising also exhibits seasonality. Advertising for soft drinks in summer, for cough and cold products in winter, for instance.
Age representation per sector
| Rank | Sector | Age diversity score |
|---|---|---|
| 1. | Telco and energy | 72 |
| 2. | Toys and events | 72 |
| 3. | Health and pharma | 71 |
Sectors showing the most age diversity in their ads
Sectors showing the least age diversity in their ads
| Rank | Sector | Age diversity score |
|---|---|---|
| 12. | Hospitality | 56 |
| 13. | Beauty and hygiene | 54 |
| 14. | Gambling | 41 |
Charts comparing age diversity in the most and least age diverse sector


Gender representation per sector
Sectors showing the most gender diversity in their ads
| Rank | Sector | Gender diversity score |
|---|---|---|
| 1. | Finance and insurance | 50 |
| 2. | Hospitality (Horeca) | 50 |
| 3. | Appliances and electronics | 50 |
Sectors showing the least gender diversity in their ads
| Rank | Sector | Gender diversity score |
|---|---|---|
| 12. | Health and pharma | 41 |
| 13. | Beauty and hygiene | 33 |
| 14. | Gambling | 28 |
Charts comparing gender diversity in the most and least gender diverse sector


Ethnic representation per sector
Sectors showing the most ethnic diversity in their ads
| Rank | Sector | Ethnic diversity score |
|---|---|---|
| 1. | Automotive and transportation | 64 |
| 2. | Beauty and hygiene | 55 |
| 3. | Telco and energy | 54 |
Sectors showing the least ethnic diversity in their ads
| Rank | Sector | Ethnic diversity score |
|---|---|---|
| 1. | Tourism and culture | 43 |
| 2. | Cleaning products | 41 |
| 3. | Gambling | 8 |
Charts comparing ethnic diversity in the most and least ethnic diverse sector

Methodology
If you have questions about the methodology or the technology used to creat the Belgian Ad Diversity Barometer, check our methodology page.